Over the last two years I have had the opportunity to accompany an experienced Dutch vet called Joost De Veer on several Cow Compass farm assessments to UK dairy farms. Although comprising some data capture, some animal scoring and a farm assessment visit, these are rather different to either Red Tractor audits, veterinary Herd Health Plans or existing processor/supermarket health and welfare audits currently carried out in the UK. They are compulsory for all milk producers in the Netherlands and are usually undertaken at six-monthly intervals by their own vet.
At LLM, both myself and Erica have been trained on how to carry out Cow Compass assessments and have now completed numerous assessments ourselves. Regular refresher training in the Netherlands helps to ensure the unifomity in assessments and to try and maintain the fundamental underlying principles of the assessment tool, which is to look for areas of ‘risk’ to either health, welfare or production, and think about easy ways to reduce these so they don’t become a bigger problem.
What is a Cow Compass assessment?
A Cow Compass assessment is essentially a holistic or ‘whole farm’ risk-based assessment, centred around seven areas, known as ‘Critical Success Factors’ that relate to the health, welfare or production of the animals on the farm. Each of these Critical Success Factors comprises several Performance Indicators, each of which themselves consist of several Management Monitoring Items. After a brief pre-visit questionnaire has been completed by the farmer, a visit is made to the farm by the vet, at which they assess each of the Management Monitoring Items according to a defined decision tree that is set out by the Dutch Quality Institute. These are all scored on a scale of 1-5, with 1 indicating the greatest risk (to health, welfare or production) and 5 the least risk (or no risk). The scores for the Management Monitoring Items help determine the Performance Indicator scores and these are then weighted to come up with the final scores for the Critical Success Factors. Not all the Performance Indicators are weighted equally as certain Performance Indicators have a greater impact than others on the overall Critical Success Factor. Any Management Monitoring Item or Performance Indicator not seen or assessed for any reason at an assessment visit is given a score of 3. For example, grazing at a visit in the winter when cows are housed.
The seven Critical Success Factors of the Cow Compass are:
- Milking
- Feeding and water
- Husbandry
- Animal welfare
- Work routines
- Disease incidence
- Youngstock
For a number of items, a scoring schedule exists to ensure uniformity in assessments and repeatability – the one for ‘feed’ is shown below. Three areas are assessed to arrive at a score: feed quantity, feed quality, and whether the feed is appropriate for the target group.
The overall score for each Critical Success Factor is arrived at from combining the weighted Performance Indicator scores, which have either been scored at the farm visit by the attending vet or arrived at from the Management Monitoring Items from data or information submitted on the pre-visit questionnaire.

Example of a defined decision tree for ‘feed’ to milking/dry cows. G=Good, M=Poor, O=Insufficient

The Cow Compass Septagram
The idea of the septagram is that it summarises the scoring that has been done for the seven Critical Success Factors in a visual way. A target score of three or greater is set for all the seven Critical Success Factors, although these can be altered if desired. Any areas below the target can be discussed and if all the seven areas are hitting the target score of three or more, then the weakest scoring area can be discussed and explored to see if any useful actions can result to improve the score.
In this example, the area of Husbandry is under the target of 3 or more at a total of 2.7. Once the whole farm assessment has been completed, a discussion can be had about why this is and how the lower scoring Performance Indicator risk areas can be improved. This discussion would include costs, action points and time scales for improvements as well as likely cost benefits that may result.

Why is it useful?
The Cow Compass assessment is intended to be a relatively quick (2 hour) ‘on the day’ whole farm assessment, which raises discussion points around risk areas and offers potential ‘quick and easy’ improvements. The seven Critical Success Factors are focussed on areas that potentially affect the production, the health or the welfare of the animals on the farm. By assessing the risk levels and identifying the lower scoring/higher risk areas, a discussion can be had about how these may be reduced. It is important to remember they are risk areas for poor production, health or welfare and a low score doesn’t necessarily mean that losses in those areas are currently occurring. I often use the example of crossing the road with your eyes shut – this is high risk but you don’t necessarily get knocked over every time. However, if you continue to do it, you will eventually get knocked over!
It is usual to focus on just a small number of areas for improvement at each assessment and also to look for the ‘easy wins’. These may be relatively easy to carry out and inexpensive but offer a good return on investment. Two such areas that commonly crop up are the water quantity and quality offered to cows and youngstock, and the access to feed for milking animals. Improving these may not dramatically change the cows that you see in front of you, they may simply increase the intakes and therefore the milk yields. Raising the top rail along a feed face will allow cows to feed more ‘square on’ to the barrier and use up less room, allowing more cows to feed at any one time. Where feed barrier space is limited, less dominant cows tend to eat in a less healthy and less natural way by taking fewer but larger feeds, increasing the risks of rumen acidosis. This may be further compounded by feed not getting pushed up often enough, limiting the time in the day that cows can feed. The additional benefit of reducing the extent to which cows have to reach is that they don’t push their necks against the feed rail and cause a chronic and painful ‘camel neck’ lesion – a welfare win!
By making small, focussed improvements on a regular basis, the marginal gains of each one stack up and can make some big overall improvements over a relatively short period of time.
Our experiences
The benefits of a Cow Compass audit are that it considers the whole farm enterprise, it is focussed on health, welfare and production and that it potentially identifies some easy (and relatively cheap) wins. The process is to think about risks and hopefully identify any issues or potential problems before they become too great, rather than deal with a disaster after it has happened. Whilst many of the principles are similar to Cow Signals, the scoring system makes the assessments more objective and therefore consistent, so that improvements can be easily measured and different farms and systems compared.
Common findings from the Cow Compass assessments that we have done include:
- deficiencies in water supply and/or quality
- lack of feed access and barriers to achieving expected intakes
- poor hygiene/high risk of contaminating young stock areas with cow faeces/cow pathogens

Example of contaminated water trough that will reduce water intake.

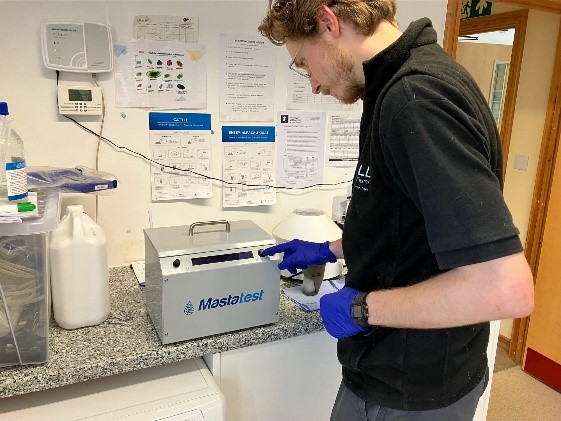
Checking the temperature of the silage clamp face to detect secondary fermentation
For more information about Cow Compass or to arrange a visit, please contact the Whitchurch practice on 01948 663000, Bill on 07968 318493 or Erica on 07842 000754


Leave A Comment